

Australian wine is well known for its quality and reliability and the Australian wine industry are world leaders in innovation and quality control. The maintenance of its reputation increases pressure on the vineyard managers to stay well within the allowed limits for the use of pesticides. As such weed control in vineyards becomes relatively complicated with a limited range of herbicides being used.
Current management strategies have led to increasing levels of herbicide resistance and incidence of hard-to-kill-weeds.
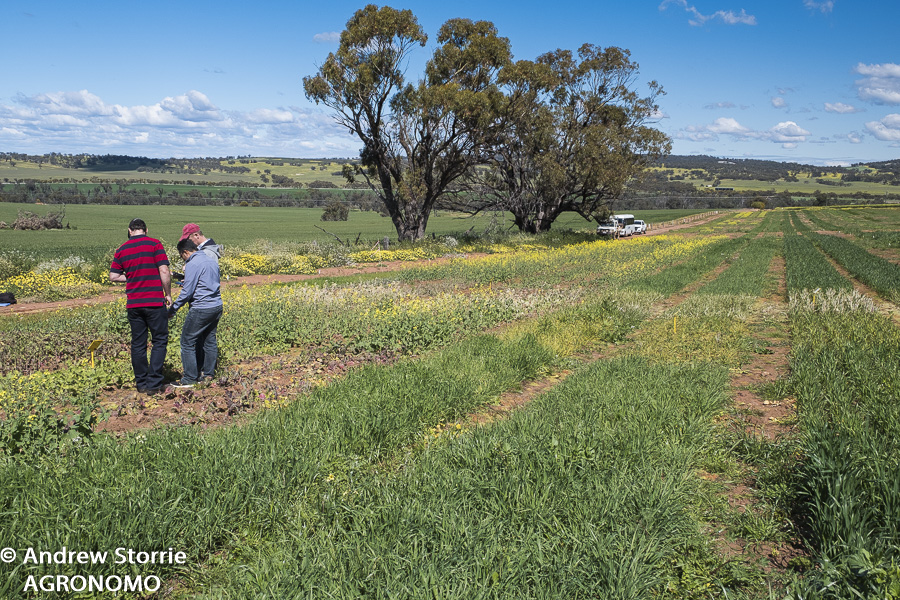
Glyphosate resistant annual ryegrass in vine row
Adding to the limited number of herbicides that are acceptable, under-vine spraying is often left until spring when weeds are large with healthy root systems. Good spray coverage then becomes difficult. Adding issues with sprayer setup then leads to highly variable weed control.
Another complication with wine grape production is the encroachment of suburbia as towns expand and get closer to areas of agricultural production. Residential developments in wine growing areas are also popular, with a mandatory golf course attached. This increases the pressure on Vineyard managers to reduce the risks of pesticides going where they should not.

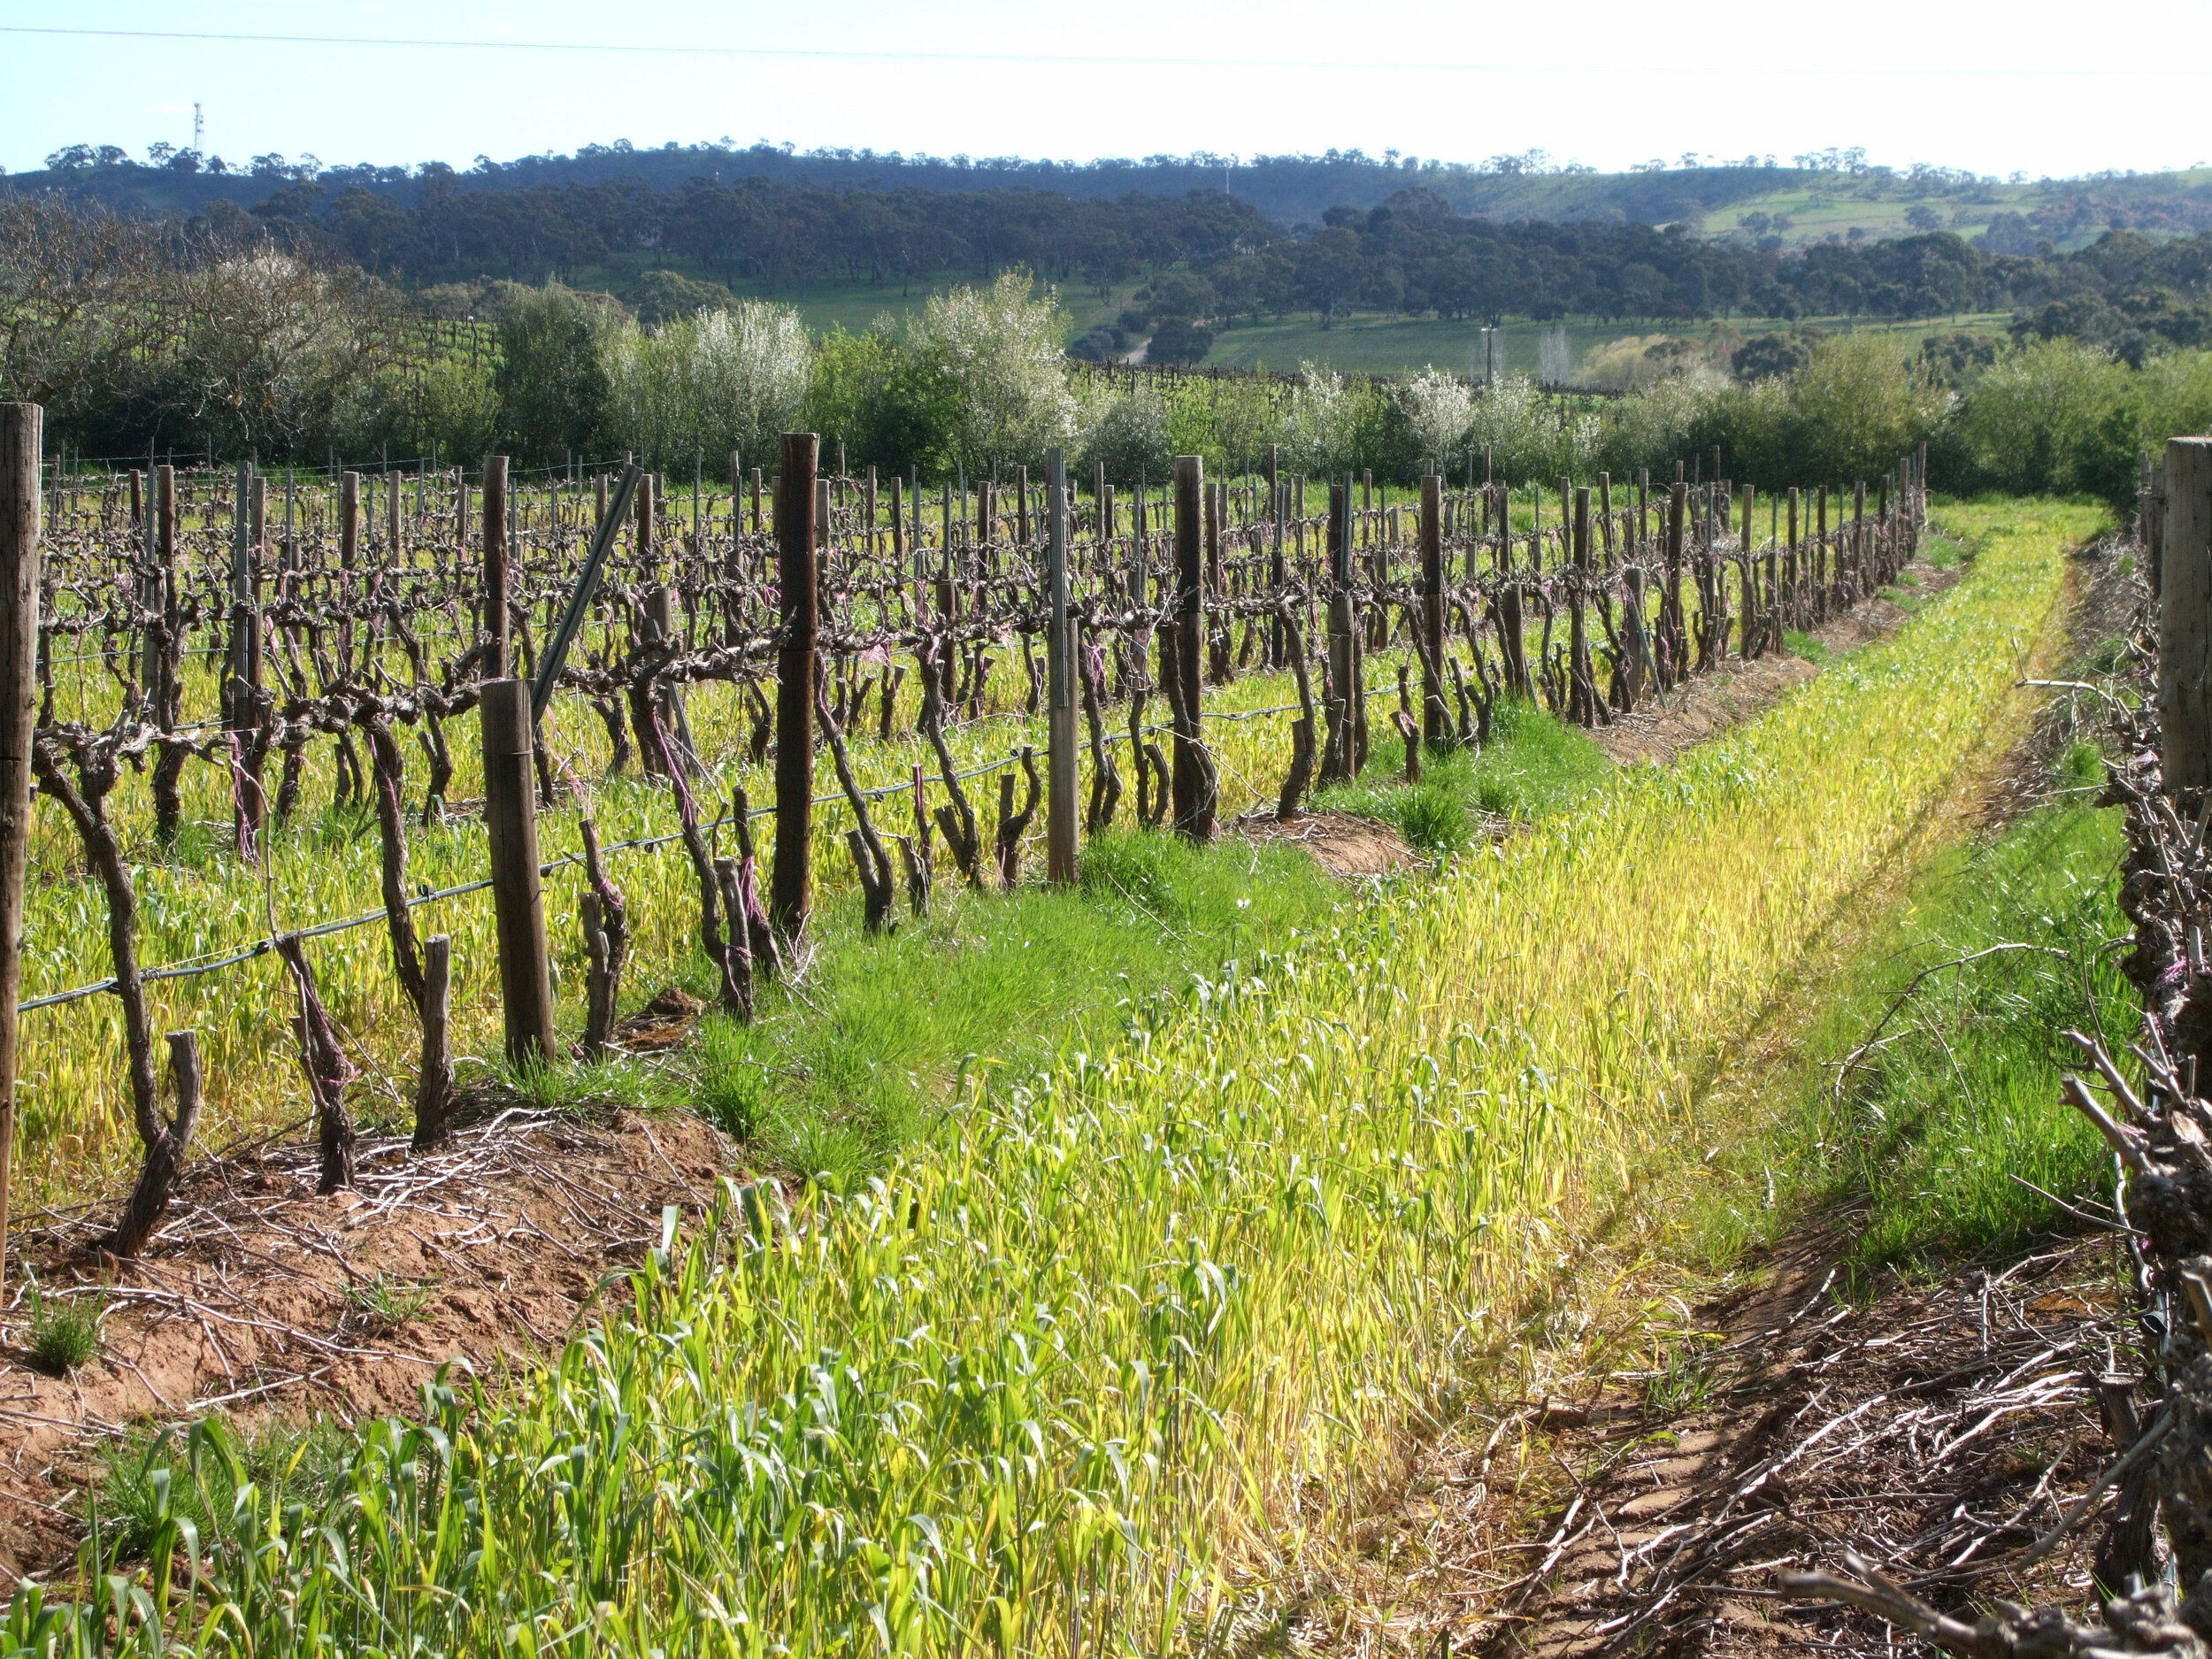
Close proximity of houses limits vine management options
To put all this in perspective wine grape growers have their fungicide applications well sorted which is understandable because fungal disease has the greatest effect on grape yield and fruit quality in wine grapes. Weeds on the other hand have a much smaller effect on the production of high-quality grapes.
Important factors in high levels of weed control are understanding how different herbicide modes of action work which then determines how they need to be applied to optimise their effectiveness. The questions we need to ask are:
What kind of target are we aiming at?
What kind of droplets are most appropriate to hit this target?
What does the product do once it deposits on the target?

Source: Syngenta
Table 1 the number of spray droplets per square centimetre and per cent area coverage for different pesticide types.
The per cent area coverage is most easily measured using water sensitive paper and the SnapCard® app.
To check what pesticides can be used in wine grape production get the Australian Wine research Institute “Agrochemicals registered for use in Australian viticulture” or commonly known as “the dog book” which is also available as app. https://www.awri.com.au/industry_support/viticulture/agrochemicals/agrochemical_booklet/
Knockdown herbicides that are permitted for use in wine grape production are listed in Table 2. This table shows the behaviours of the different herbicide modes of action. Glyphosate is highly translocated and therefore very forgiving in application technique whereas paraquat is the opposite. Products like paraquat that are translocated need much higher levels of coverage therefore product rate and application volume are critical for high levels of weed control.
Seedling grasses smaller than 3 leaf make a challenging target so it is important to keep the application volume up to ensure there are enough droplets to hit the target.

Table 2 Knockdown / Non-selective herbicides
A small number of selective herbicides are allowed and often used in the inter row area. Most of these herbicides are poorly translocated and also need good coverage to be effective.

Table 3 Selective herbicides
Soil active (residual) herbicides (Table 4) have a set of characteristics which must be understood the get optimum weed control. For example they work poorly if the soil is dry. Sufficient soil moisture is needed to allow the weeds to absorb the herbicide from the soil water. Also due they work poorly or not at all on emerged plants so need to be applied to bare ground or tank-mixed with a compatible knockdown herbicide. Some managers tend to minimise the use of residuals for these reasons and because there is often a lot of dead plant material under the vine row which will intercept the herbicide.

Table 4 Soil active herbicides
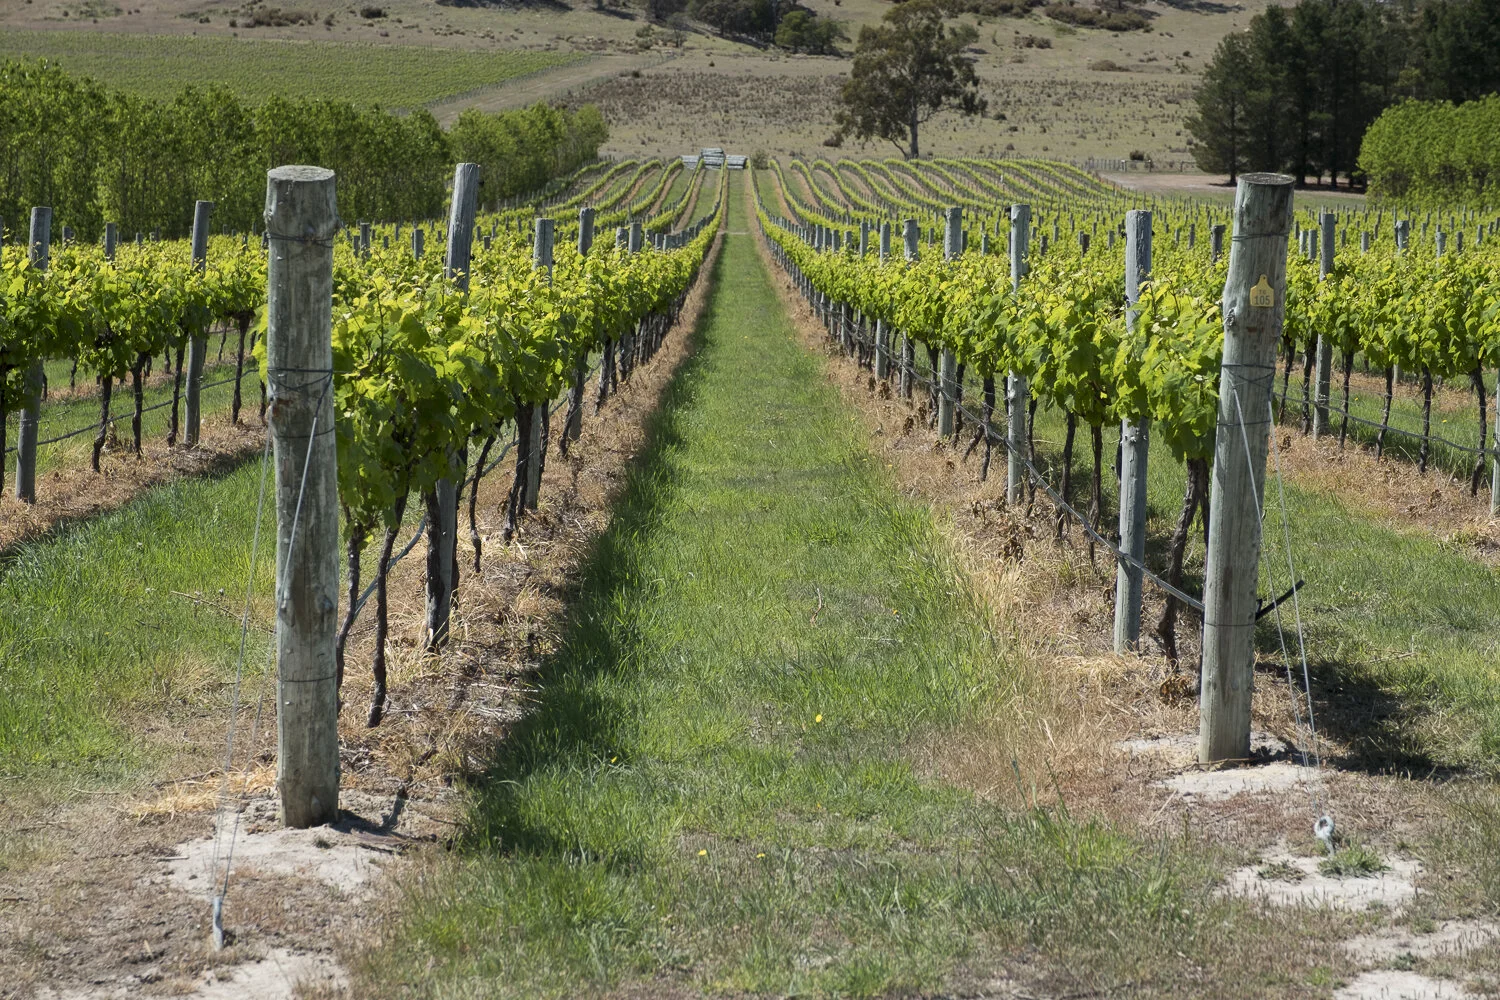
Lower levels of trash under the vines opens options for using soil active herbicides
Because of the limited number of herbicides available for use in vineyards and the increase in herbicide resistance it is essential for vineyard managers to understand the characteristics of these herbicides when developing their weed management plans.